
City and County Minimum Wage Rate Guide: Updated for July 1, 2026
Rates confirmed as of June 4, 2026; effective July 1, 2026.
The federal minimum wage hasn’t increased since 2009. In response, smaller jurisdictions have taken it upon themselves to set their own rates. States, counties and cities continue to pass new minimum wage laws, creating challenges for employers to manage rates across their organizations.
Tracking, applying and communicating minimum wage rates for large employers has become increasingly complex. This guide gives an overview of updates at the county and city levels.
- This guide only covers county and city minimum wage rates for large employers that update on July 1, 2026.
- State wage rates are not included, nor are county and city wage rates updated at other times of the year.
- Please note: some local laws have been preempted by higher rates at the state level and are not included here.
- Looking for updates by state? View July 1, 2026 State Minimum Wage Rates, in GovDocs' Employment Law News.
- Industry/sub-industry requirements
- Tipped wage rules
- Small employer rates
- Number of employees
- Company revenue thresholds
- Student/learner wages
- New employee wages
- Overtime requirements
- Employer-provided health benefits
Key Midyear City and County Minimum Wage Stats:
City and County Minimum Wage Rates Effective July 1, 2026
Use the table below to search by city or county and sort any column to compare minimum wage rates effective July 1, 2026.
Or, click the button below to view the guide as a PDF.
Please note: This wage rate guide is intended for market awareness only; it is not to be used as a substitute for legal advice or counsel
| State | Jurisdiction Name | Jurisdiction Type | Wage Amount | Effective Date |
|---|---|---|---|---|
| CA | Alameda | City | $17.76 | 7/1/2026 |
| CA | Berkeley | City | $19.61 | 7/1/2026 |
| CA | Emeryville | City | $20.34 | 7/1/2026 |
| CA | Fremont | City | $18.05 | 7/1/2026 |
| CA | Los Angeles County Unincorporated | County | $18.47 | 7/1/2026 |
| CA | Los Angeles | City | $18.42 | 7/1/2026 |
| CA | Malibu | City | $17.91 | 7/1/2026 |
| CA | Milpitas | City | $18.50 | 7/1/2026 |
| CA | Pasadena | City | $18.57 | 7/1/2026 |
| CA | San Francisco | City | $19.61 | 7/1/2026 |
| CA | Santa Monica | City | $18.47 | 7/1/2026 |
| IL | Chicago | City | $17.05 | 7/1/2026 |
| IL | Cook County | County | $15.40 | 7/1/2026 |
| MD | Montgomery County | County | Large: $18.00 | 7/1/2026 |
| OR | Oregon Non-Urban Counties | County | $14.55 | 7/1/2026 |
| OR | Oregon Standard Counties | County | $15.55 | 7/1/2026 |
| OR | Portland Metro Area | City | $16.80 | 7/1/2026 |
Note: State wage rates are not included in this guide, nor are tipped wages, industry-specific rates or rates for employers of other sizes.
This guide is intended for market awareness only. It is not to be used as a substitute for legal advice or counsel.
Need Ongoing Minimum Wage Tracking?
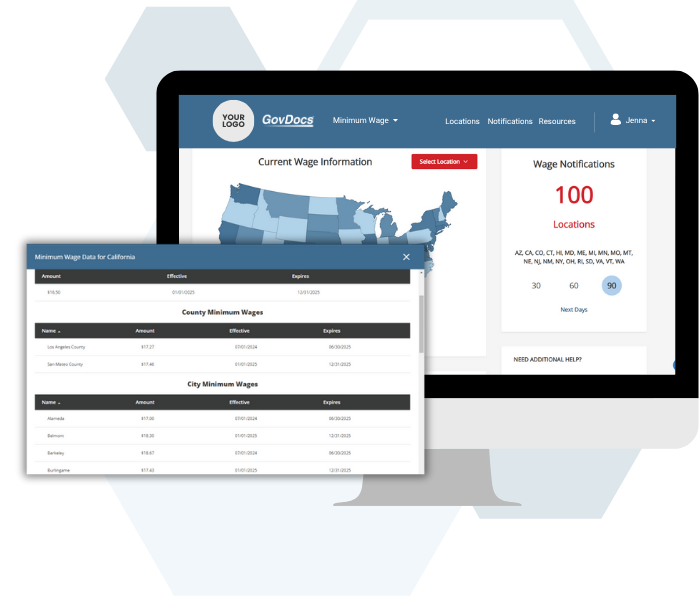
GovDocs Minimum Wage helps employers monitor city, county, state, and federal wage updates automatically so you can stay ahead of changing requirements.
- Track wage changes across jurisdictions
- Receive update notifications
- Reduce manual research
Frequently Asked Questions on July 1 Minimum Wage Updates:
Seventeen cities and counties across four states have minimum wage increases effective July 1, 2026. These jurisdictions span California, Illinois, Maryland, and Oregon.
California: Alameda, Berkeley, Emeryville, Fremont, Los Angeles (city), Los Angeles County (unincorporated), Malibu, Milpitas, Pasadena, San Francisco, and Santa Monica.
Illinois: Chicago and Cook County.
Maryland: Montgomery County.
Oregon: Oregon Non-Urban Counties, Oregon Standard Counties, and the Portland Metro Area.
For a complete list of rates by jurisdiction, see the sortable table above or download the PDF guide.
Among the jurisdictions updating on July 1, 2026, Emeryville, California has the highest city minimum wage at $20.34 per hour.
Emeryville has historically maintained one of the highest local minimum wage rates in the country. Other high-rate California cities updating on July 1 include Berkeley and San Francisco, both at $19.61 per hour, followed by Pasadena at $18.57 and Milpitas at $18.50.
Note that this guide covers jurisdictions with July 1 effective dates. Rates in other cities may differ and update at other points in the year.
Effective July 1, 2026, the minimum wage in the City of Los Angeles is $18.42 per hour. The Los Angeles County unincorporated areas have a separate rate of $18.47 per hour.
Employers with locations in the Los Angeles area should pay close attention to which jurisdiction governs each worksite as city boundaries and unincorporated county areas do not always align with common address references.
Additional location-specific factors, including industry requirements, tipped wage rules, and employer size, may also affect the applicable rate. Consult legal counsel for compliance guidance specific to your workforce.
Effective July 1, 2026, the minimum wage in Chicago, Illinois is $17.05 per hour.
Employers operating in the broader Chicago metro area should also be aware that Cook County has a separate minimum wage of $15.40 per hour, effective the same date. The Cook County rate applies to unincorporated areas of the county and municipalities that have not opted out of the county ordinance.
Employers with worksites in both Chicago and suburban Cook County locations should verify which rate applies to each specific location.
Effective July 1, 2026, the minimum wage in San Francisco, California is $19.61 per hour.
San Francisco consistently maintains one of the highest local minimum wages in California. The rate applies to employees who work at least two hours per week within the geographic boundaries of the city and county of San Francisco, regardless of where the employer is headquartered.
As with all local rates, employers should factor in applicable industry rules, tipped wage provisions, and any other requirements under San Francisco's labor ordinances. This guide is intended for general market awareness and is not a substitute for legal advice.
Multi-location employers face a compounding compliance challenge: minimum wage rates vary by jurisdiction, update at different times of year, and may differ based on employer size, industry, or employee type.
Common approaches to managing multi-jurisdiction minimum wage compliance include:
- Manual tracking: HR or payroll teams monitor government sources for each jurisdiction. This is time-intensive and prone to missed updates as the number of locations grows.
- Payroll system alerts: Some HRIS and payroll platforms include wage update notifications, though coverage and accuracy vary.
- Dedicated compliance software: Purpose-built tools like GovDocs Minimum Wage monitor city, county, state, and federal rates automatically, flag changes, and support payroll accuracy across all locations — reducing manual research and compliance risk at scale.
For employers managing dozens or hundreds of locations, automated tracking is typically the most reliable and efficient option.
GovDocs Minimum Wage tracks city, county, state, and federal rates automatically.